What’s the (Real) Rate of Soil Health Practice Adoption?
If you can’t measure it, you can’t improve it. — Lord Kelvin

Those of us in conservation agriculture talk a lot about scaling the adoption of cover crops and conservation tillage in the US. Indeed, these practices are key to conservation and climate adaptation and mitigation. They can reduce nitrogen pollution to waterways, build soil organic carbon and soil health more broadly, and protect crop yields from weather extremes. For decades, many public and private investments have been made to get more farmers to implement these practices on more US acres. But how do we know whether that investment is leading to more adoption? How can we talk about scaling sustainable agriculture if we don’t know how much we have? This is where Lord Kelvin’s quote from above comes in.
I led a team of scientists from the public, private, and non-profit sectors to test different data sources to see “What is the (real) rate of soil health practice adoption?” That’s the title of our open-access journal article that came out this week in the Journal of Soil and Water Conservation. Here, I’m going to give you the quick-and-dirty summary.
What we did: Compared data
We compared three data sources estimating the percentage of acres in a county that have winter cover crops, no-till, reduced tillage, and conservation tillage. It’s important to emphasize that they are all estimates; none of them are 100% accurate. The data sources use contrasting methods:
US Census of Agriculture – “AgCensus,” a survey of farmers and landowners conducted by USDA every 5 years. Data are public.
Operational Tillage and Information System – “OpTIS,” derived from publicly available satellite imagery by Regrow. County-level data are private.
Illinois Soil Conservation Transect Survey – “Transect,” a drive-by windshield survey of fields conducted by conservation staff using a randomized route. Historic data are publicly available, but the survey was discontinued after 2018.
We compared these data in central and southern Illinois and western New York (AgCensus and OpTIS only) for the crop years 2015 through 2021. These are regions where AFT is active and provide contrasting climates and agricultural settings. We used statistical analysis to compare the data in years and counties where they overlapped.
What we found: Definitions matter
Before looking at the statistical analysis, a major finding was how different the definitions of the practices are across data sources. All sources use a percentage of plant residue covering the soil surface to categorize tillage types, but their cutoff values differ by 10 percentage points or more.
We also found that some data sources collect data by the calendar year (AgCensus) and others by the crop year (OpTIS and Transect use Nov. 1 to Oct. 31). This made it unclear which crop year to use to compare to the AgCensus calendar year and had a significant impact on how the data comparisons shook out. For example, Illinois tillage data agreement improved dramatically when we compared the 2017 AgCensus calendar-year data to the OpTIS 2017 crop-year data rather than the OpTIS 2018 crop-year data.
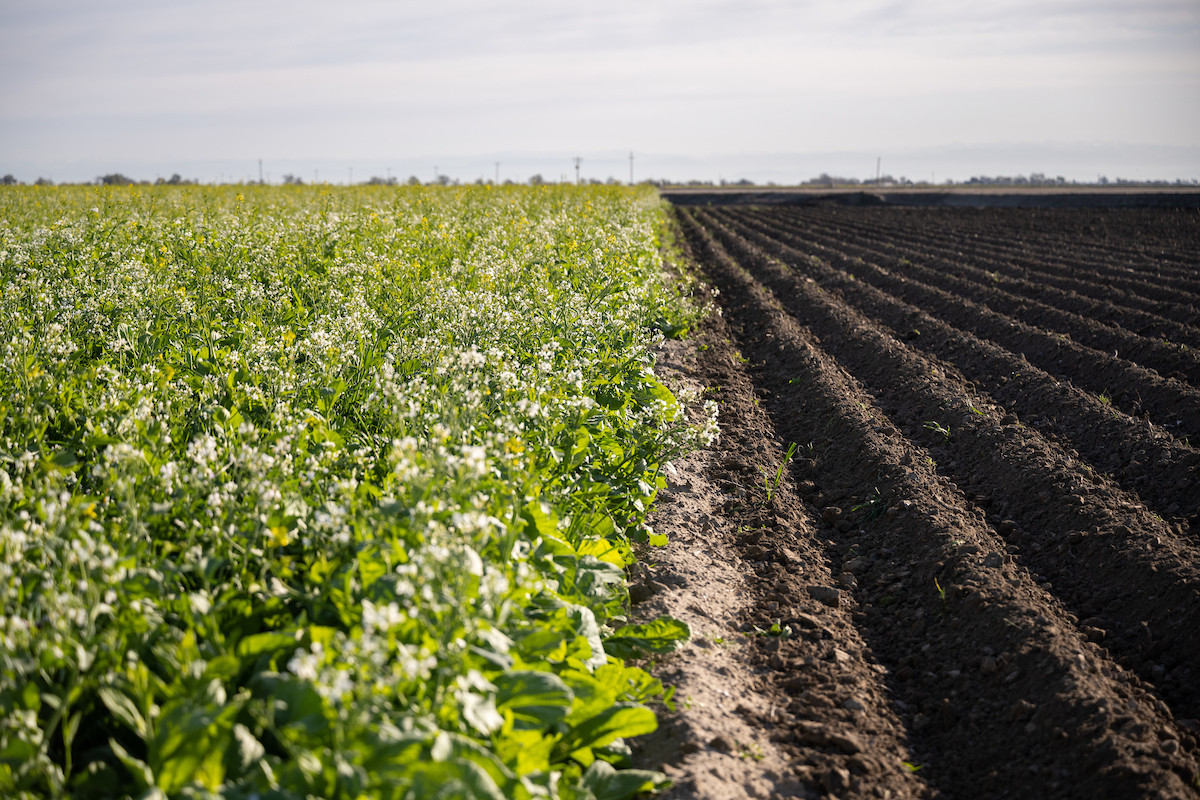
Some data sources lump all croplands together, while others only analyze corn and soybean acres. This did not matter much in central Illinois, where 99% of croplands are growing corn and soybeans, but in western New York, where croplands are more diverse (and potentially use less no-till than corn and soybean fields), the tillage data comparison showed larger discrepancies. Similarly, western New York and southern Illinois have more fields that look green in winter satellite imagery but are not winter cover crops (hay fields, pastures, winter wheat), meaning great potential for misidentifying cover crops. Cover crop estimates were more different between data sources in western New York and southern Illinois, but agreed well in central Illinois. On a related note, the AgCensus is filled out in December and January and asks how many acres were planted to a cover crop, but satellite imagery and drive-by surveys rely on a cover crop being visible, which is another reason for discrepancies.
Next steps
So how can we know how well we’re scaling adoption if we can’t even compare measurements across datasets?
Solution: Bring these data sources and other groups together to co-design a standardized set of definitions we can share moving forward to make data more comparable. The AFT Research team is actively pursuing funding to support this work.
Also, we hypothesize that these data are not all that useful in their current forms for conservation professionals on the ground to track their progress and target outreach going forward.
Solution: We believe that improving these and other data sources’ accessibility, transparency, spatial and temporal scales, and comparability is an important step in transforming conservation from random acts of conservation to precision conservation approaches. The AFT Research team is actively pursuing funding to survey conservation professionals to understand how they do or don’t use adoption data and design tools and resources that could help bridge the gap.
More data are not a silver bullet for improving practice adoption and permanence, but they can help conservation programs measure that which they hope to improve.
We are grateful to the Foundation for Food and Agriculture Research for a Seeding Solutions grant that supported this work.