New Census of Agriculture Shows Decline in Number of America’s Farms, Farmers, and Farmland
The 2017 Census of Agriculture released yesterday shows an across-the-board drop in the number of farms, farmers, and farmland in the United States. Land in farms declined from 914,527,657 acres in 2012 to 900,217,576 acres in 2017, while the number of farms and “primary producers” decreased from 2,109,303 in 2012 to 2,042,220 in 2017. This news has serious implications for food production, our environment, and the next generation of farmers.
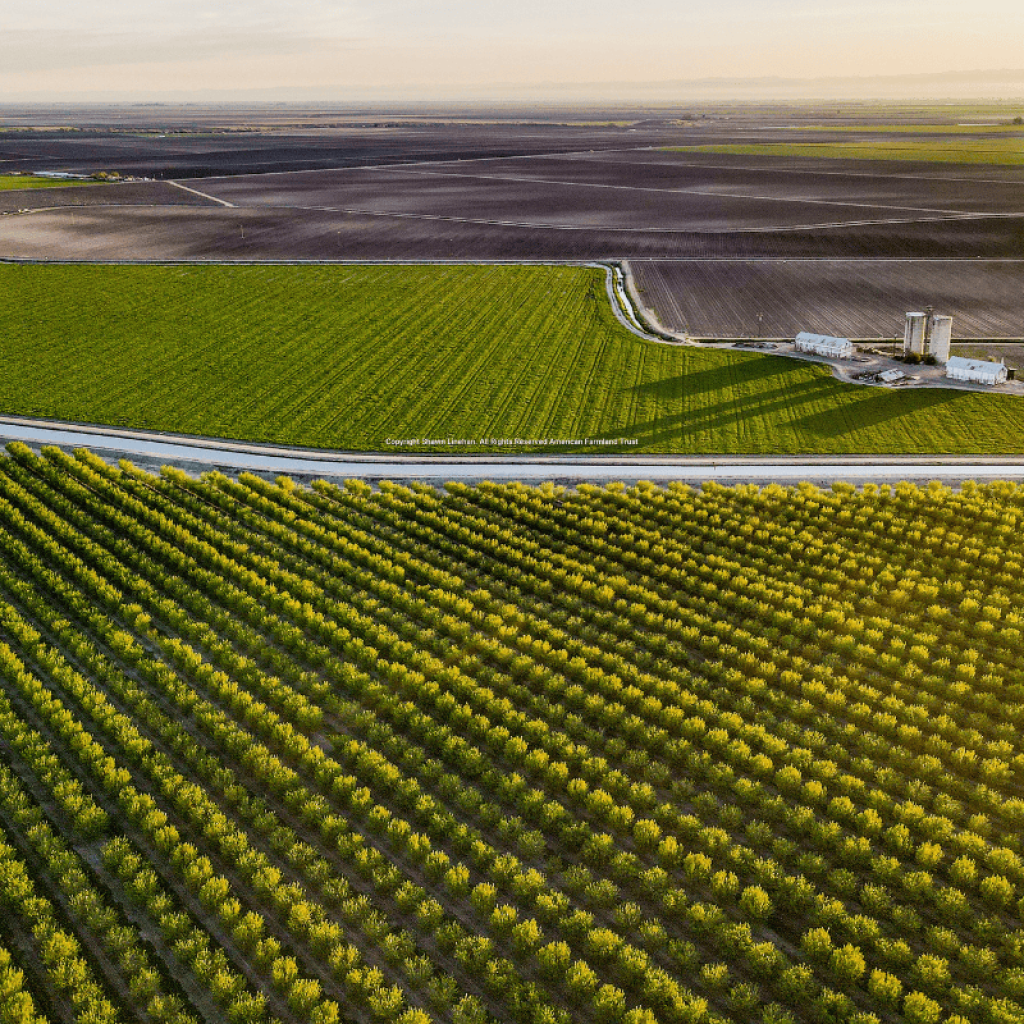
As with each Census of Agriculture, American Farmland Trust starts our analysis with the land. Farmland and ranchland are the critical infrastructure—the same as our roads, bridges, and highways—upon which agriculture depends. Next, we always take a deep dive to look at who farms the land because AFT recognizes that without the farmers there is no agriculture. Here are a few key takeaways we’ve seen so far:
Land in Farms
- Fewer acres of land in farms: Down 14,310,081 acres (a two percent drop)
- Most states saw a decline: 34 states experienced a reduction in land in farms
- Biggest acre losses: Texas, New Mexico, Montana, Wyoming and California
- Largest percentage decreases: Rhode Island, Connecticut, New Hampshire, Maine, Massachusetts—four of the five reported double-digit percentage decreases
- Little change in share of land devoted to agriculture: Land in farms hovers at 40 percent of the nation’s land area
- The good news is complicated: 16 states experienced upticks in land in farms amid the nationwide decline. We’ll be looking to see if increases in land in farms coincide with increases in the number of farms, producer, or beginning producers.
Farmers (i.e., Producers)
In the 2017 Census of Agriculture, USDA’s National Agricultural Statistics Service, or NASS, changed the way it reports on individuals’ roles in farm operations to do a better job capturing their contributions. This led to more people being identified as “producers,” (which now replaces “operators” in Census lingo) and a jump in the number of beginning producers. But despite the apparent growth in new and beginning producers, all producers are getting older, and the number of young producers inched up less than two percent. Highlights include:
- More producers (equivalent to all operators): Up 6.9 percent from 2012 to 3,399,834
- Fewer primary producers (comparable to principal operators): Down from 2,109,303 in 2012 to 2,042,220 in 2017
- Beginners are on the rise: The 908,274 new and beginning producers based on 10 year or less of experience on any farm who now account for 26.7 percent of all producers and the 472,360 new and beginning primary producers based on 10 years or less of experience on any farm represent 23.1 percent of all primary producers. It’s hard to make direct comparisons to 2012 because NASS used different experience ranges and sometimes only counted experience on the operator’s present farm (versus any farm). But another current measure of new and beginning producers based on less than 10 years of experience on their present farm counted 510,536 new and beginning producers among primary producers, up a healthy 9 percent from a comparable number in 2012.
- Beginners still come in all ages: 32 percent of all new and beginning producers are 55 and older
- Farmers are aging: The average age of all producers climbed to 57.5 years and the average age of primary producers hit 59.4
- The proportion of senior farmers is growing: There are more than six times as many primary producers age 65 and older as primary producers 34 and younger
- Slight uptick in primary producers: Producers 34 and younger inched up from 119,833 in 2012 to 121,754 in 2017
Farms Under Threat
Here’s something else to keep in mind: The census doesn’t track what happens to land that is no longer counted as part of a farm or how land was used prior to being identified as part of a farm. This means that decreases in land in farms don’t equal conversion, and gains can happen in places where farmland and ranchland is being lost to development. This can be confusing and make people think we don’t have a problem. AFT launched Farms Under Threat, an analysis of the location, quantity, type, and quality of agricultural land lost to development, to help people understand what’s happening to our farmland. We’ll use new data from the census to inform our spatial analyses.
This is our first take on the 2017 Census of Agriculture. AFT’s Farmland Information Center will dig into the census data over the coming weeks and release additional posts. In the meantime, thank you to the farmers who responded to the census and the staff at NASS who collected, analyzed, and published this snapshot of U.S. agriculture in 2017.