Mission
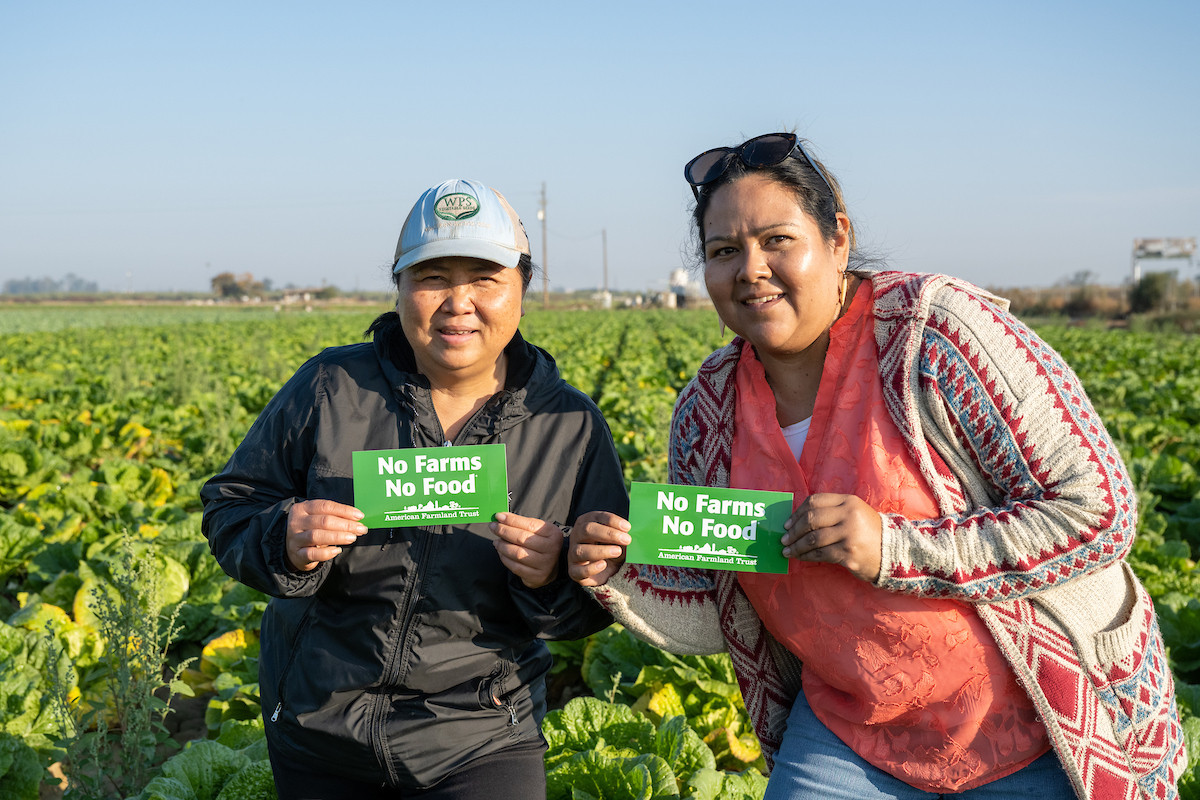
American Farmland Trust’s mission is to save the land that sustains us by protecting farmland, promoting sound farming practices, and keeping farmers on the land.
LEARN MORE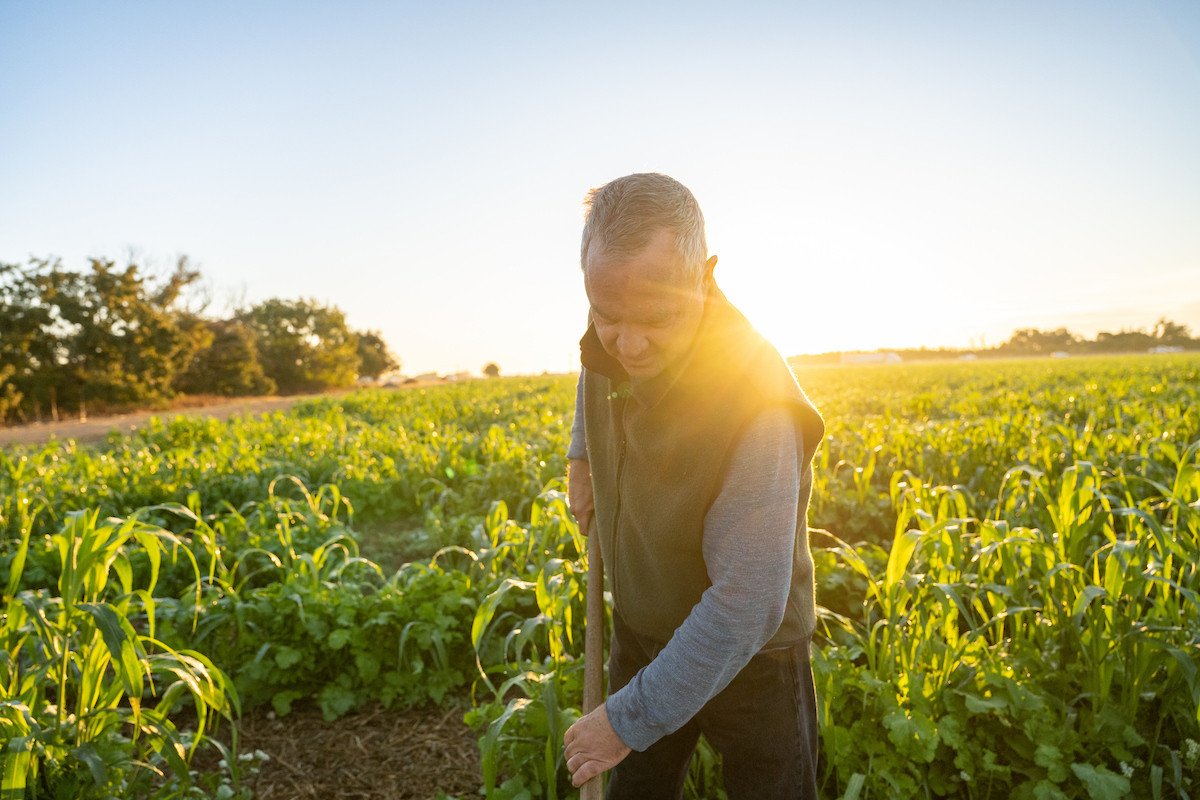
Our Work
We pursue our mission strategically through projects and initiatives across the country.
LEARN MORE.png)
Where We Work
American Farmland Trust works nationwide to protect vital farmland, ensuring that farming remains a way of life for generations to come.
SEE WHERE WE WORK BY STATE AND REGION.png)
Farmland Information Center
The Farmland Information Center (FIC) is a clearinghouse for information with the nation’s largest online collection of print materials, laws, and sample documents related to farmland protection. It is a project of American Farmland Trust (AFT) maintained on behalf of and with support from the USDA Natural Resources Conservation Service (NRCS). Our staff provides direct technical assistance and answers requests for information via phone or email.
VISIT THE FICRecent News
Introducing Prosperity Partners
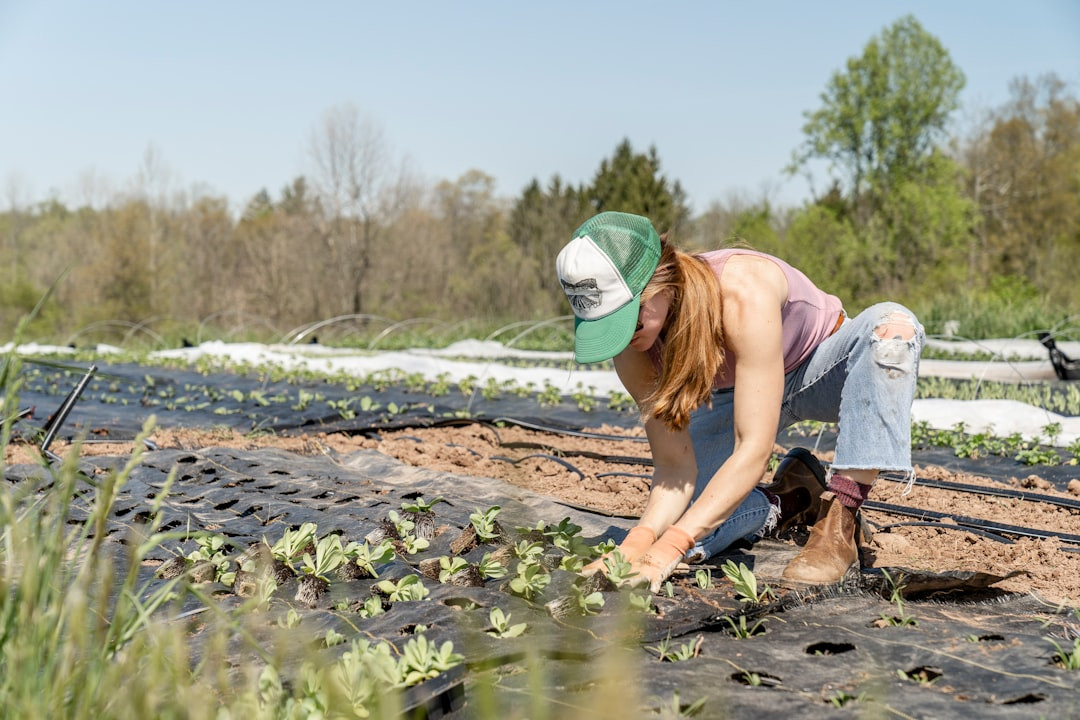
Whether you're a farmer or solar developer seeking custom solutions, let our advisors help you chart a course to success.
LEARN MORE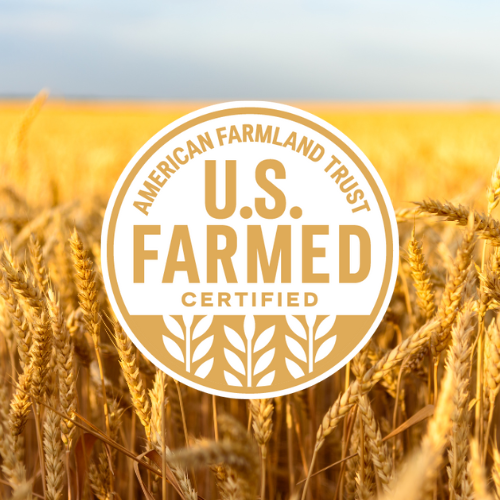
U.S. Farmed ™ Program Certification
With the U.S. Farmed ™ Certification, American Farmland Trust is taking a bold step forward with brands committed to strengthening and sustaining American agriculture with a new certification designed to differentiate products made with ingredients grown in the United States. By choosing U.S. Farmed Certified products, consumers support American farmers and invest in the future of domestic production, ensuring a secure and sustainable food supply for all.
LEARN MORE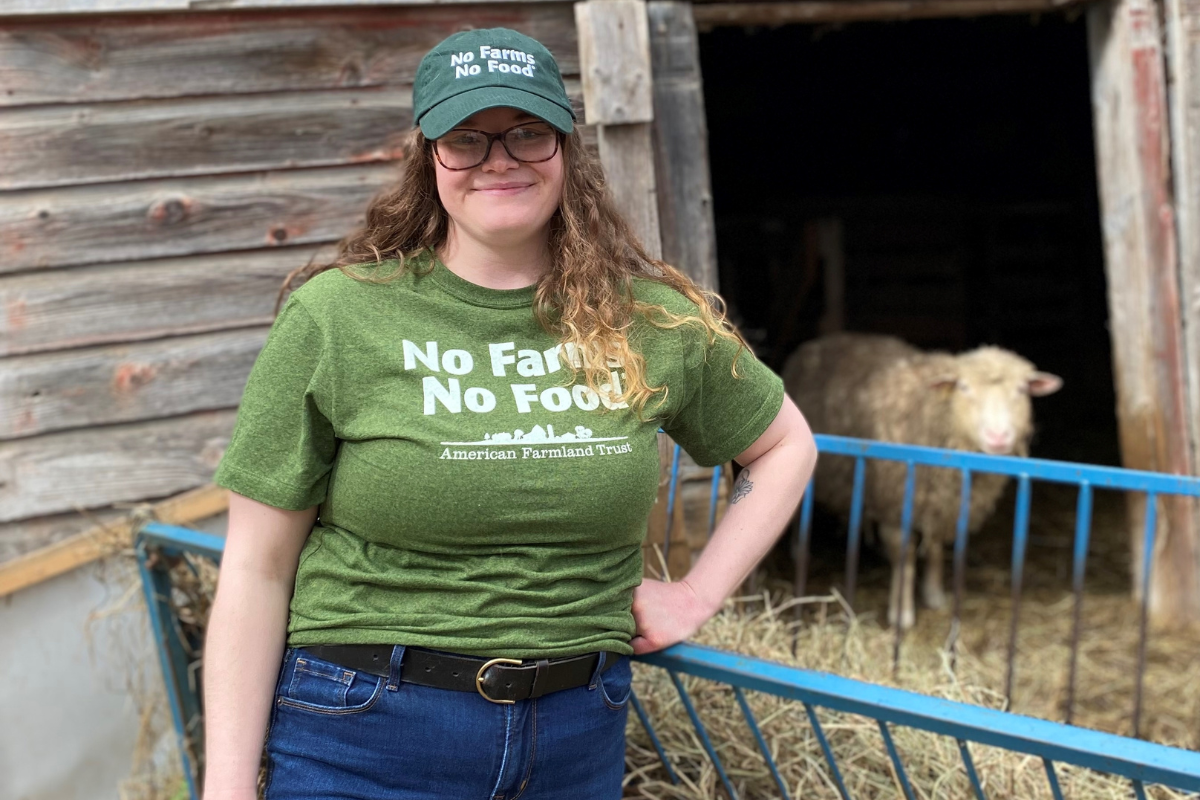
Shop Merch
The official American Farmland Trust store is your source for No Farms No Food® gear. Every purchase directly supports our mission, with 100% of proceeds dedicated to protecting farmland, promoting sustainable farming practices, and ensuring farmers stay on their land.
SHOP


.png)
.jpg)
.png)


